
Sometimes you have a lot of things to do, but you don´t have the means for that, so you will have to create your own means. We will apply this “philosophy” to present the data you have in your database, but you don´t have access to any reporting tool. In this case, we will create a report from scratch.
For this experiment we will use Microsoft SQL Server as data repository and C#.NET as programming language.
*Actually, I am not wrong, if you have license for SQL SERVER, then you have license for SQL Server Reporting Services too, but let´s consider that you don´t 🙂
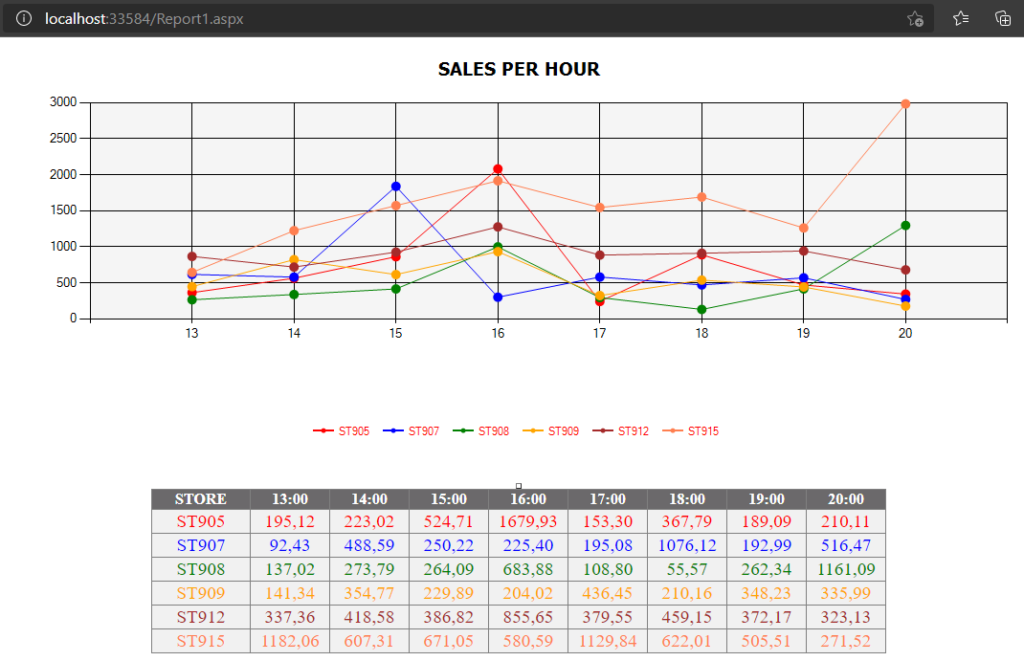
We just need to think that we will retrieve the necessary info to be presented from database, next we will feed our visual components with this info. For this report, we will consider a layout as shown in the draft below.
This is for a chain of stores which we want to show the sales performance (Amount $) per hour by store (from 13:00 to 20:00).
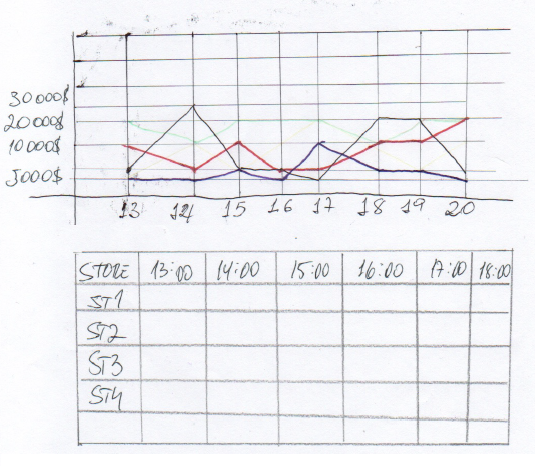
So we will have basically a chart that will be a graphical representation of the data, and a gridview that will be the data as is.
DATABASE QUERIES
– LIST THE STORES: We will need this query to create the series in the chart. It will bring the list of stores.

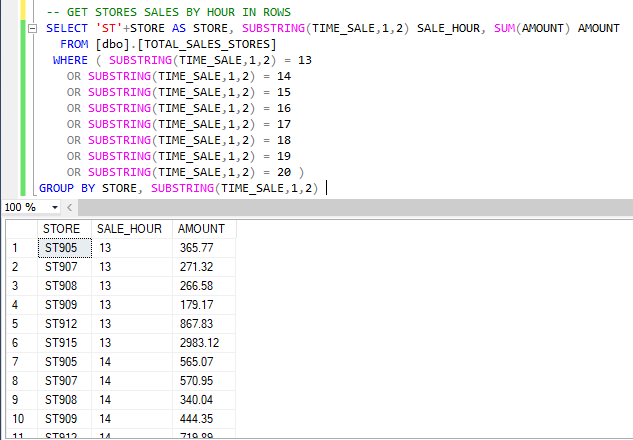
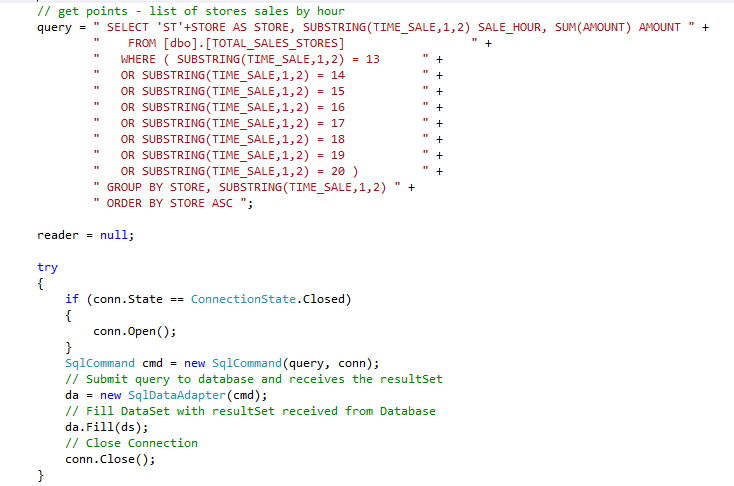
– LIST SALES PER HOUR IN ROWS: This will use this info to feed the line chart. Note in the picture below, on the results, we have the STORE, the HOUR and the AMOUNT. The store will be a serie, the HOUR will be the X axis and AMOUNT will be Y axis.
– LIST SALES PER HOUR IN COLUMNS: Since we have a fixed number of hours in the analysis (from 13:00 to 20:00), we prefer to see the amount for each hour in columns (as shown on the draft above). That´s why we have to do some manipulations in the query in order to transform rows into columns.

Now that we defined the queries we need to feed the visual objects, now we can start creating our reports.
VISUAL STUDIO CSHARP (C#)
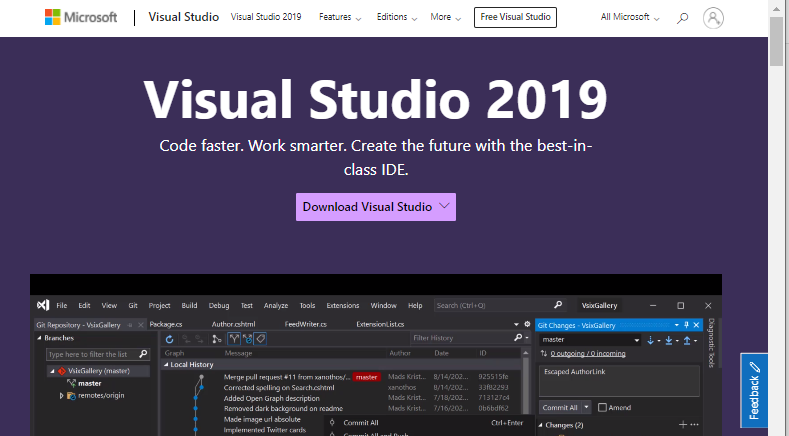
For this execise we are using the csharp language, so you will need a c sharp development tool to do so. I am using Visual Studio in which I have the csharp available. If don´t have yet, go ahead download, install it and let´s start coding.
Visual Studio 2019 IDE – Programming Software for Windows (microsoft.com)
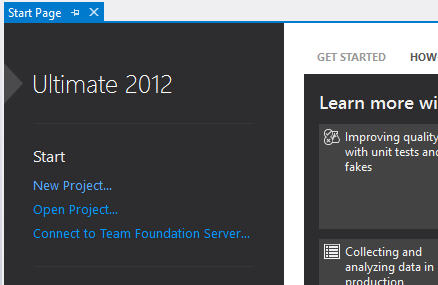
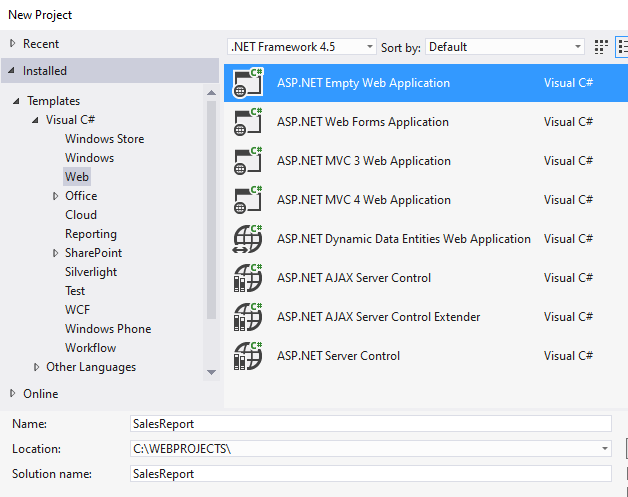
– CREATE A NEW PROJECT
(I know… I am using a very old version, but for what we need to do it does the job.)
Under Visual C#, Select Web -> ASP.NET Empty Web Application.
Give it a name and choose a location.
Now we have a project
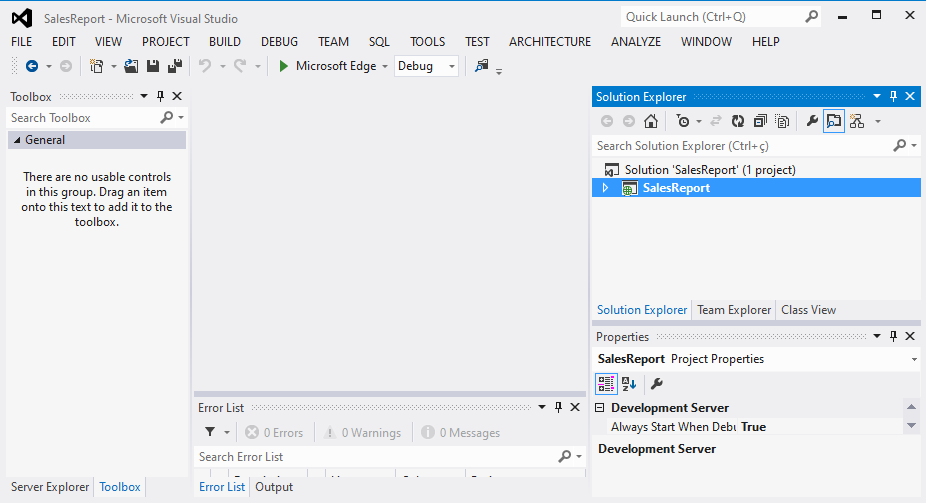
We will create a page in which we will present our visual components. For that reason we will add a WebForm to this project. On your right hand side, on the window “Solution Explorer”, right click on “SalesReport” -> Add -> WebForm

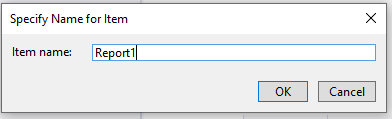
Specify the name, in our case will be “Report1”
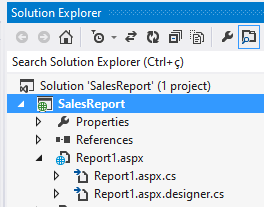
Now you have a aspx page

Note that when you add a WebForm, you will have to handle the aspx page, which will be the front end of the page, and the CS file, which will have the back-end functionalities (variables, events, database connections and etc…)
Now we will add the visual components on the aspx page:
ASPX PAGE
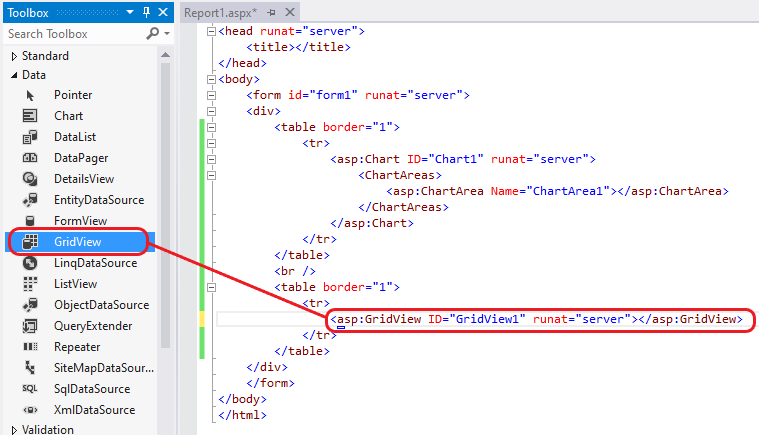
– CHART: On your left hand side, on the “Toolbox” window, click on “Chart”, drag and drop it on the aspx page. I included a <table> block just to organize the objects on the window.

– GRIDVIEW: On the same window “Toolbox”, click on GridView drag and drop it on the aspx page.
I included a <table> block here too.
Now, we have the components added to the page, but they´re empty. We need to feed them with data. That´s what we´ll do in the next step.
CSHARP FILE
Now we have to handle the class “Report1.cs” in order to do everything we need to bring data from database to fill the visual components in the Aspx page.
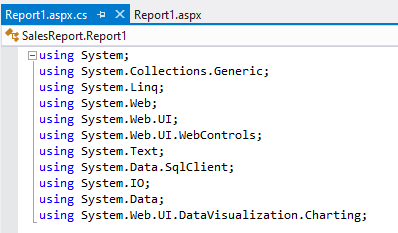
– Import Libraries
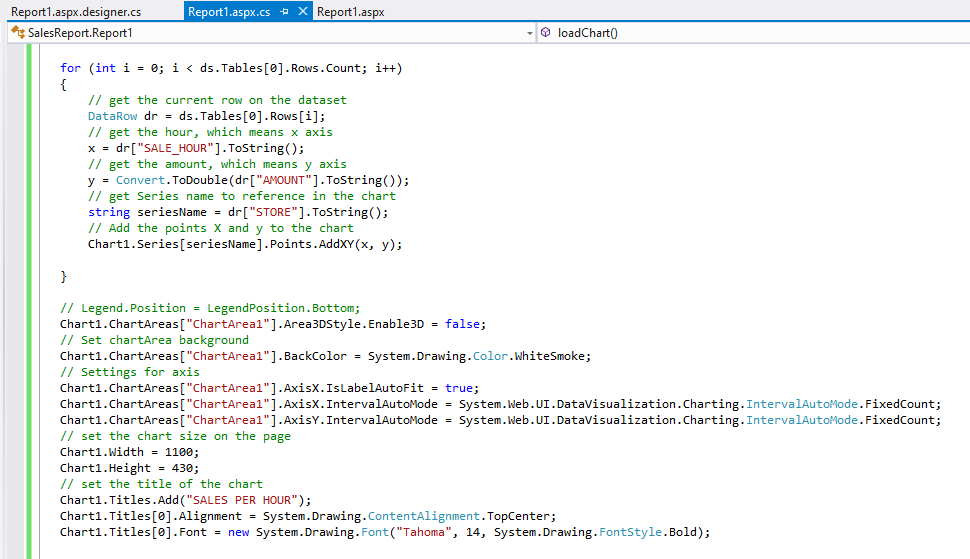
– Create a method to load chart
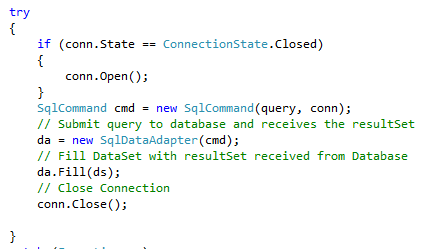
Connect Database: Create a database connection and query data to be used by the visual objects.

Load Series Dataset: Bring resultSet from Database to local DataSet.

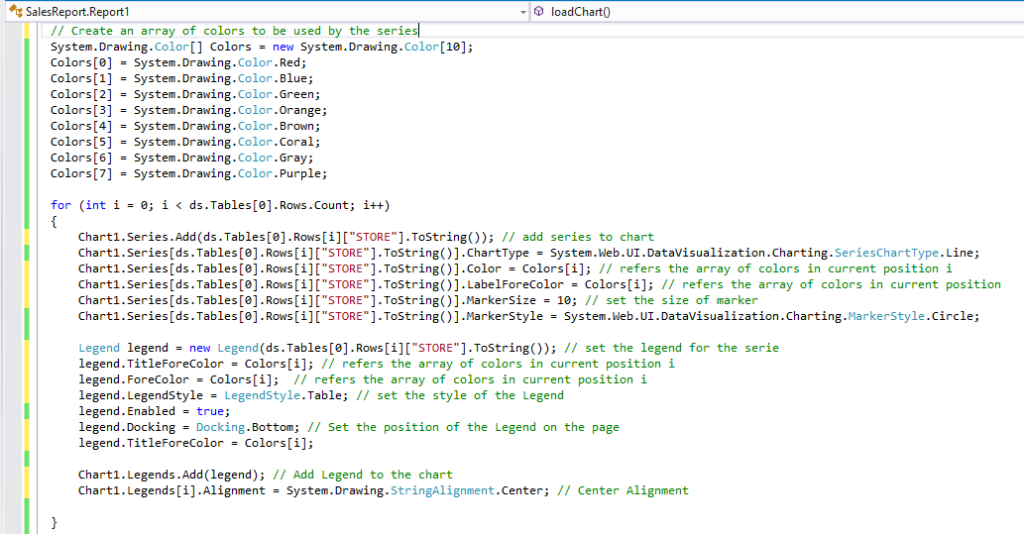
Load Series into chart: Use DataSet loaded from Database to make settings on Chart Series.
Load Points Dataset: Bring data from database, which contains STORE, HOUR and AMOUNT$. The STORE will define which series the info refers to, the Hour refers to the X Axis, and amounts is the Y axis.
Load Points into Series: Use DataSet loaded from Database to Add points to Chart Series.
– Create a method to load gridview
Connect Database: Create a database connection and query data to be used by the visual objects.
Note that in the query below, we make it in the way to convert lines into columns in order to have the gridview as defined in the draft shown above.

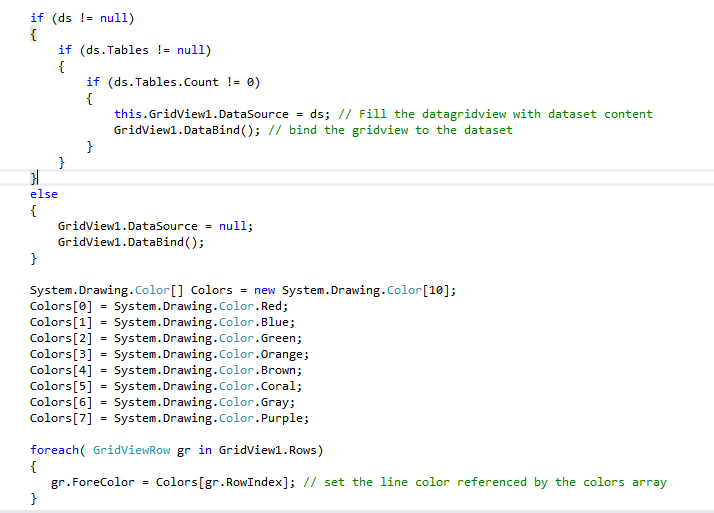
Load gridview dataset:
Load Gridview: in this step we redirect the data from database to the Gridview, next we use the array of colors in order to the lines from series have the same colors of their respectives in the gridview.
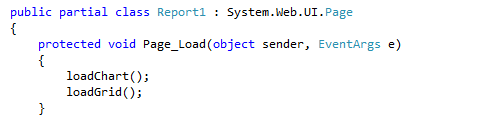
Call both methods in the Main Method.
EXECUTE !!!

THAT´S IT:
Since it´s a HTML page, you can use some CSS to improve the look and feel. The purpose here is to show you what you can do with CSHARP.